Preventing Data Breaches: Strategies for Organizations
Prevent data breaches with strategies like strong authentication, encryption, regular audits, employee training, and real-time monitoring to protect...
Learn how to integrate Excel and Eskuad for efficient field data management. Step-by-step guide for seamless data extraction and visualization.
Mastering data-driven decision-making is key in the ever-evolving landscape of the forestry and wood products industry. This step-by-step guide takes you through the combined prowess of Excel and Eskuad, two dynamic software solutions poised to revolutionize your workflow.
Eskuad is a leading field software management solution tailored for field workers in various sectors, including forestry and logging, port operations, etc. This innovative platform offers real-time insights and optimization tools to enhance resource management, predict maintenance needs, and streamline supply chain operations. Eskuad is designed to empower businesses with user-centric features, fostering efficiency, sustainability, and strategic decision-making.
Microsoft Excel stands as the go-to platform for robust data visualization and analysis. Its charts, graphs, and pivot tables empower users to derive meaningful insights from raw data, laying a solid foundation for informed decision-making. Excel's data visualization features are accessible to users of varying skill levels, making it an accessible and widely used tool for decision-making, reporting, and analysis.
Integrating Excel's user-friendly data visualization and Eskuad's specialized field software management creates a powerhouse solution. Excel's visualization prowess complements Eskuad's operational optimization, providing businesses with a comprehensive solution to enhance resource management, predict maintenance needs, and streamline supply chain operations.
This is a helpful guide for those looking to take their field data analysis and understanding to the next level. Below you will find the required steps that you need to take, to create the API integration between Eskuad and Excel.

The first step is to obtain the API Key from Eskuad. This key will serve as the connection between Eskuad and Excel. Follow these steps to obtain the key:


Once the API Key has been created, we can continue to Step 2 in the integration process. For this next step, you will need to open Excel.
In this step, we will go over how to conduct the API connection and extract data from Eskuad directly into Excel. First:


2.4.a To sync all data from Eskuad: https://api.eskuad.com/api/v1/form-updates
2.4.b To sync data from a specific report (database reports only): https://api.eskuad.com/api/v1/form-updates/formupdates_json?reportId=REPORTID
Please note that option b's last part of the link, "REPORTID," should be replaced with the report ID of the database report you wish to sync.
For example, if your report ID is ABC123, your URL would be: https://api.eskuad.com/api/v1/form-updates/formupdates_json?reportId=ABC123 *This is an example link
*** For instructions on obtaining the report ID, please see the "Extra Steps" section at the end of this article. ***
2.4.c To sync data from a specific report (database reports only) with a specified date range: https://api.eskuad.com/api/v1/form-updates/formupdates_json?reportId=REPORTID&date_from=YYYY-MM-DD&date_to=YYYY-MM-DD
For option c, the "REPORTID" part of the link should be replaced with the report ID of the database report you wish to sync. The first date of your desired date range will be placed after the "date_from=" part of the URL in a YYYY-MM-DD format. The last date of your desired date range will be placed after the "date_to=" part of the URL in a YYYY-MM-DD format.
For example, if your report ID is ABC123, and your desired date range is January 1st 2024 to February 17th 2024, your URL would be: https://api.eskuad.com/api/v1/form-updates/formupdates_json?reportId=ABC123&date_from=2024-01-01&date_to=2024-02-17 *This is an example link

Please note: To implement other types of filters in step 2.4 that are not related to form data extraction or to learn more about our Public API; please see more advanced API information here: DOC API Currently only available in Spanish


At this point, you have successfully connected Eskuad with Excel using an API call for seamless data extraction. You should be proud of yourself!
All that is left to do is simply review your data and ensure you are happy with how it looks. Here is what you need to do:


Note: If this is not what you want your data to look like, or if you would like to edit any of the past steps, you can click on any of the Applied Steps on the right-hand side.

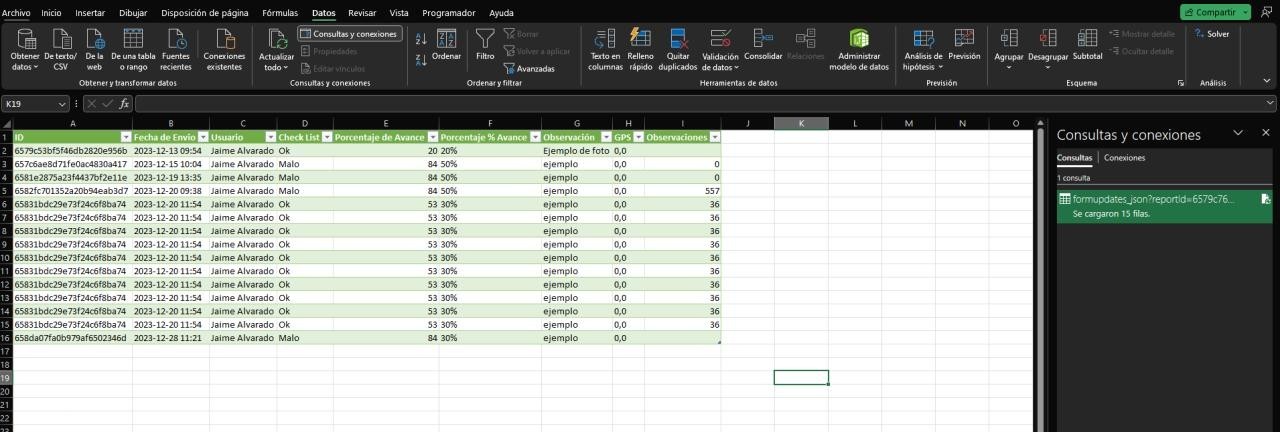
To update your data, click the "Refresh All" button in the Connections section of the Data tab

Now, you can build dynamic tables, graphs, and formulas that update automatically with data directly from Eskuad.

In the web panel, head to (a) “Reports” → (b) “Report Templates” → select the report you wish to sync → (c) “Edit” button (pencil icon)

Once you are in the template editing screen, head to the URL. Copy the digits after the last forward slash “/.” This is your Report ID

Thank you for reading! I hope this guide has been helpful in your integration efforts. If you have any specific questions or if you would like to learn more about Eskuad, please feel free to contact me, or you can always visit https://eskuad.com/.
Prevent data breaches with strategies like strong authentication, encryption, regular audits, employee training, and real-time monitoring to protect...
The best practices in efficient mobile form building can streamline data collection, improve accuracy, and enhance business workflows.
Real-time data in logging operations boosts efficiency, safety, decision-making, cost reduction, compliance, sustainability, and customer...